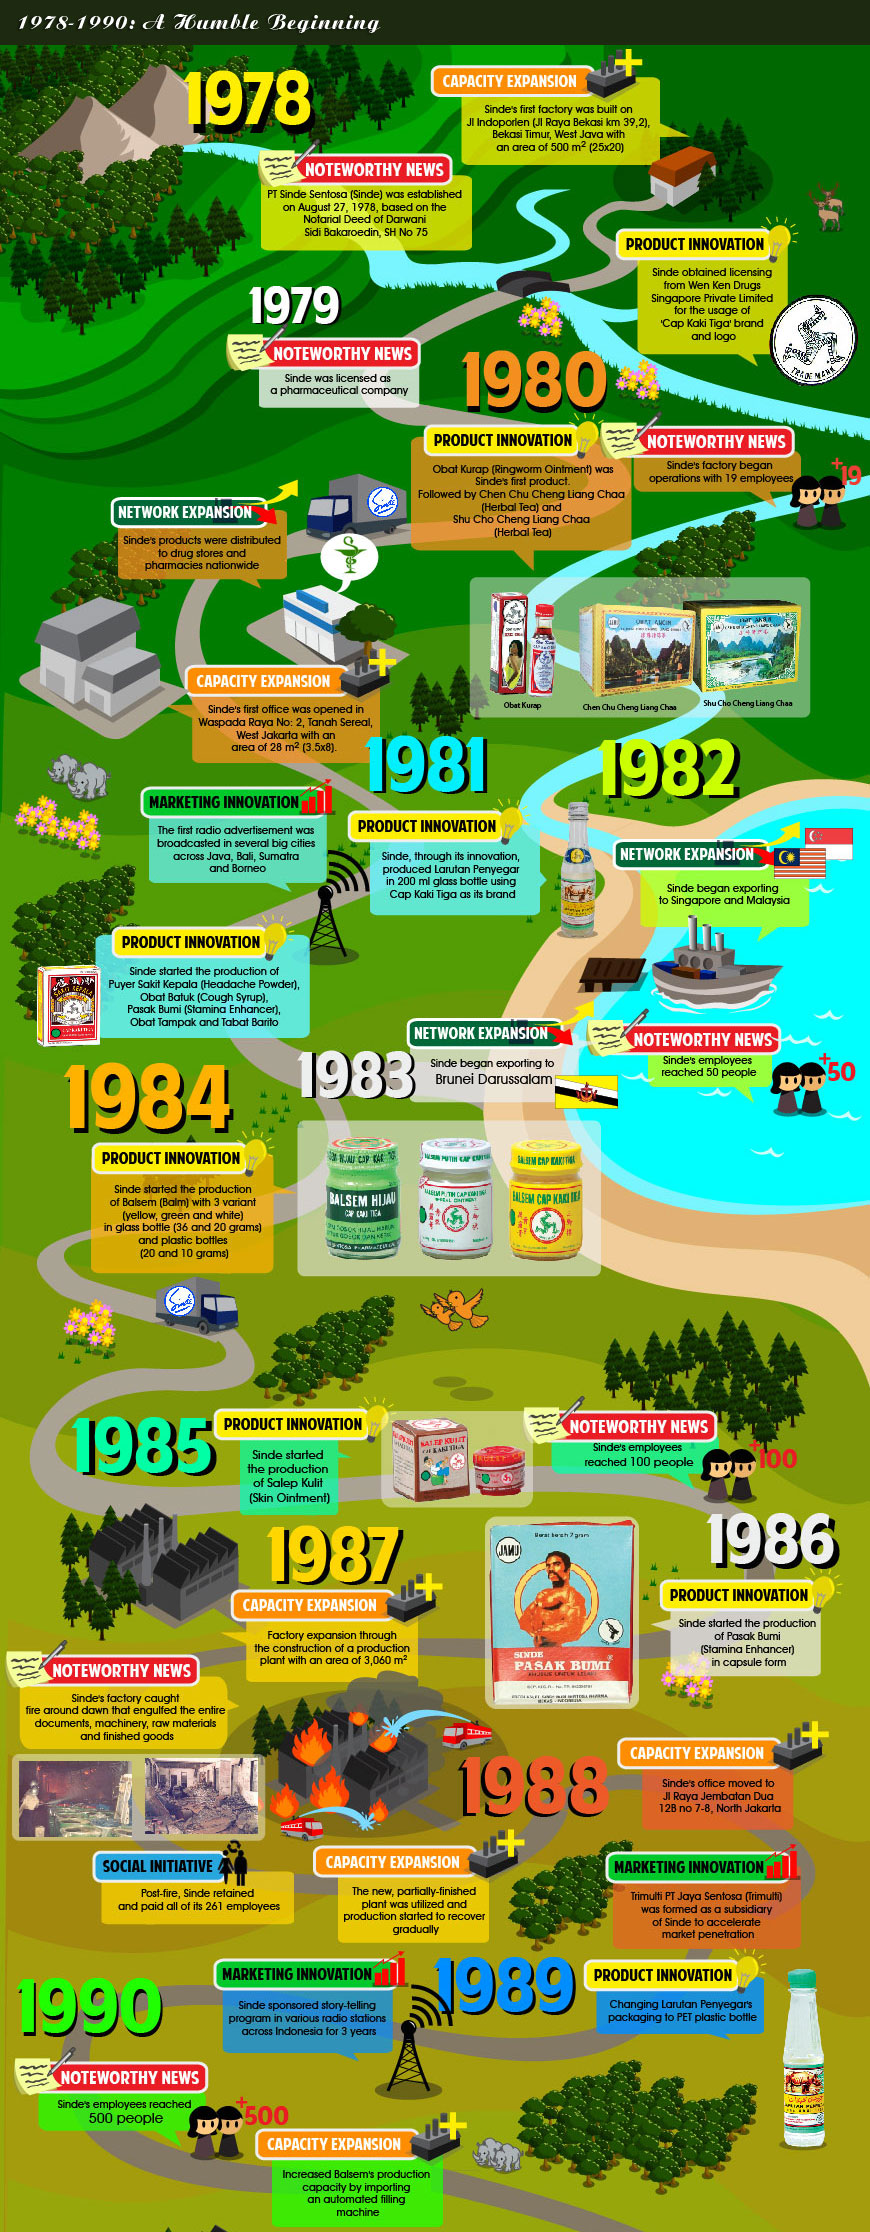
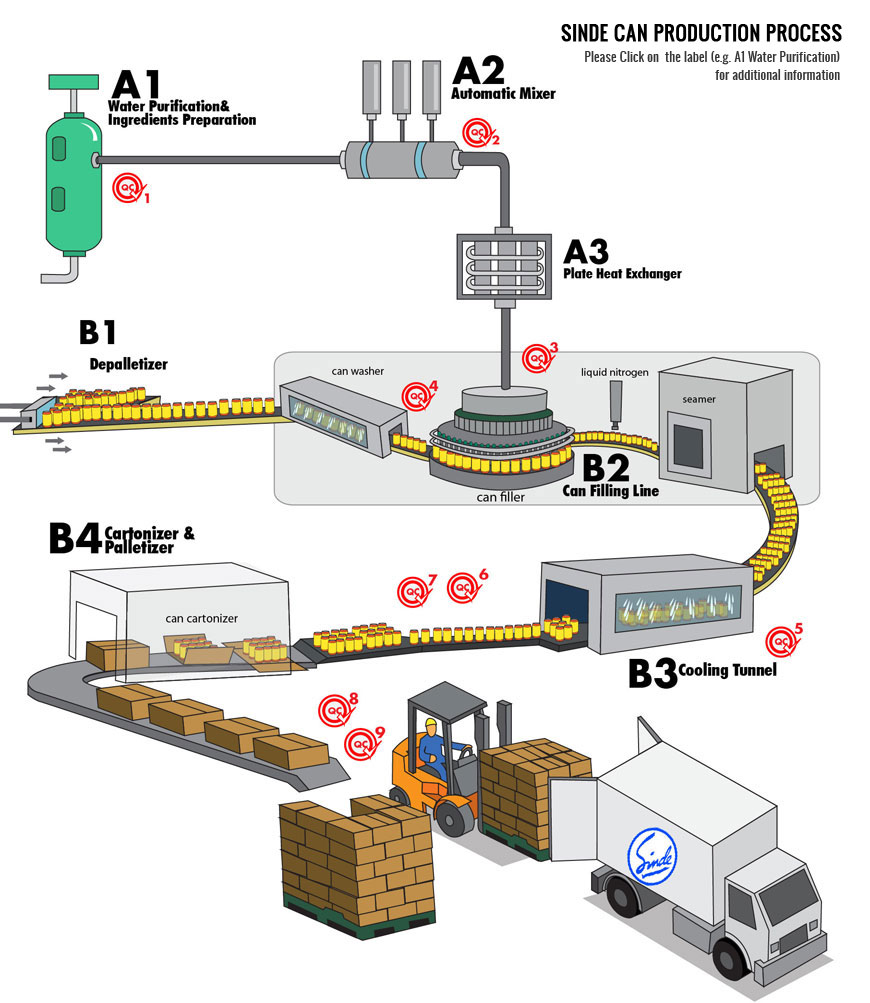
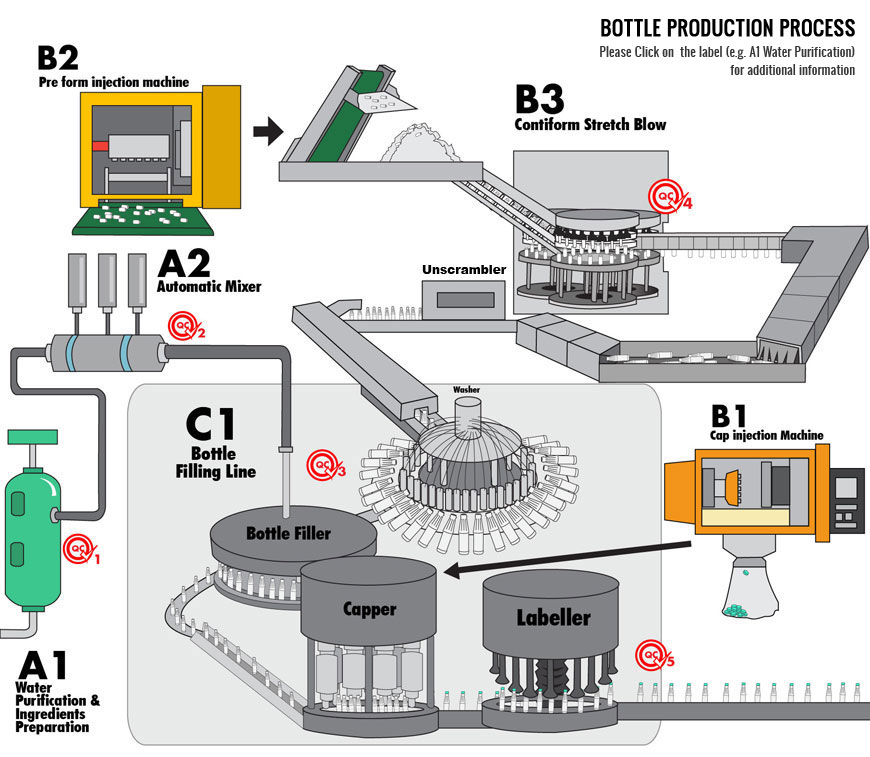
Infographic also known as Information Graphics is a representation of information in a graphic format designed to make the data and information easily understandable. Infographics used in business to quickly communicate a message, deliver data patterns and relationship information and to simplify the presentation of large amount of data without having to read large amounts of text, the viewer can easily process the information that is being shared and is given the chance to explore a topic in a highly engaging way.
Infographics are important since they change the way people find information and experience stories. Infographics create a new way of seeing the world of data, help communicate complex information and ideas in a clear and beautiful way.
Few Reasons Why Infographics Work
- Most of us tend to have shorter and shorter attention spans, for which (unsurprisingly) looking at a captivating image beats out reading large amounts of text.
- We are constantly exposed to information overload via our computers, tablets, and smartphones. The key is no longer to get the information out there, but to get attention for it.
- Human beings are highly visual and can absorb visual information faster and more easily than other kinds of information.
- Most people forget a large amount of what they’ve read, but they do remember what they’ve seen. Infographics are more fun and engaging than plain text.
- Infographics done right do not only make it easier to understand complex information, but boost both the creator’s profile and website traffic.
- Infographics allow the creator to showcase his or her knowledge about a certain topic.
- A good infographic can spread quickly on the Internet, giving other bloggers and writers something to talk about, and the creator backlinks and exposure. Be sure to include a logo and URL on the image for copyright purposes.


 © Copyright 2013